|
YOUR FINANCIAL INDEPENDENCE THROUGH TRADING
NEW METHODS AND ARTIFICIAL INTELLIGENCE TO WIN IN TRADING
 TODAY TRADING IS THE PATH TO FINANCIAL INDEPENDENCE
TECHNOLOGY HAS CHANGED EVERYTHING
Today everything is possible
Technology gives you the power
- Internet democratizes access to data and trades
- The computing capacity of your computer is greater than that of NASA thirty years ago
- Our server and our AI do the work of 100 people for you
- You can be as efficient as a professional hedge fund
Recent volatility laws put you in control
- They boost the chances of success of each trade
- They allow perfect risk management
- You always know where you are, there is no more stress
Brokers and markets are waiting for you
- Transaction costs have become very low 1/1000° of the trade amount
- Leverage allows significant gains even with small capital
- Small and therefore accessible future contracts exist, E-Mini, E-micro
You choose your pace of life
- Scalping, Day Trading, Fast Swing, Slow Swing, each at their own pace
- Our simulation tools allow you to start in real conditions without risk
- Book “Universal Trading”, In-depth seminars, Videoconferences, we support you
BOOST YOUR TRADING WITH THE MOST IMPORTANT RESEARCH CONTRIBUTION IN 20 YEARS
BEST SELLER ON AMAZON !
New Research on Volatility Changes Everything in Trading
The book "Universal Trading" changes the entire vision of trading
- The book demonstrates stable statistical behavior of markets
- You will understand how this stability leads to highly efficient trading methods
- You will never see trading like before again, you will become a "universal trader"
- The book is available on Amazon
A starting point that changes everything
- Volatility (standard deviation of prices) follows a statistical distribution law
- This statistical distribution is stable over time
- We find the same distribution curve in all frequencies
- We find the same distribution curve on all markets
Trading profits are immediate
- Statistical stability of standard deviation extends to other types of movements
- Certain price movements are therefore also statistically measurable
- A statistical measure can reflect a trading advantage at a given time
- Taking a position in the direction of advantage is statistically winning
Statistical stability and computing power change everything
- The complexity of the calculations is erased by our tools
- Scalping, Day Trading, Fast Swing or Slow Swing are continuously analyzed
- The main markets (currencies, indices, cryptocurrencies) are analyzed in each rhythm
- The last chapter of the book presents the site's functionalities in detail
Mastering the laws of volatility changes everything
- The combined volatility statistics draw a parabola of the most likely price movement
- Analysis of the parabola determines whether or not a directional advantage
- Buy/sell signals are validated or not in a rational manner
- In case of validation, the Profit/Loss statistical ratio rPl is known
Fast Swing Trading Example on Future Gold
- Buy/sell signals validated by volatility statistics
- Four days, four trades
- Operations on 1 E-mini Gold MGCG5
- Earnings in 4 days $1480, hedging consumption $1225
ARTIFICIAL INTELLIGENCE DOES THE HEAVY WORK. JUST DECIDE WHEN TO TRADE !
OUR AI HAS LEARNED "UNIVERSAL TRADING" METHODS
It will do the daily work for you!
Precision and Objectivity in Market Analysis
- In-depth analysis of price movements within Bollinger bands and linear regression channels.
- Identification of market configurations without emotional bias, based solely on statistical laws of volatility.
- Probabilistic assessment of future movements using statistical distributions of price variations.
Optimization of Trading Decisions
- Automated and optimized determination of probable areas of price development.
- Calculation of the probable profit/loss ratio before each trade for better risk management.
- Generation of statistically evaluated buy and sell signals, based on a scientific approach rather than arbitrary indicators.
Power of Artificial Intelligence at the Trader's Service
- Fuzzy logic: to refine the probabilities of price developments and avoid rigid thresholds.
- Expert system: to model the best trading strategies based on proven statistical rules.
- Neural network to reliably detect reversal patterns, even with subtle variations.
A Powerful Tool for an Informed Trading Strategy
- Hyper efficient rapid market analysis based on advanced calculations impossible to do manually.
- A 100% scientific and statistical approach, based on the results demonstrated in the book “Trading Universel”.
- A tool designed to optimize traders' performance by leveraging the power of calculation and advanced mathematical models.
To follow the trend or not: statistical approach
- The most relevant channels ate plotted by the AI based on volatility statistics.
- Prices are constantly moving within a channel.
- The duration and amplitude of the channels follow a stable statistical distribution law.
- The probabilities of a channel extending are constantly known, which makes it possible to decide whether to follow the trend or not.
- The internal volatility of the channel may or may not validate a signal in the opposite direction
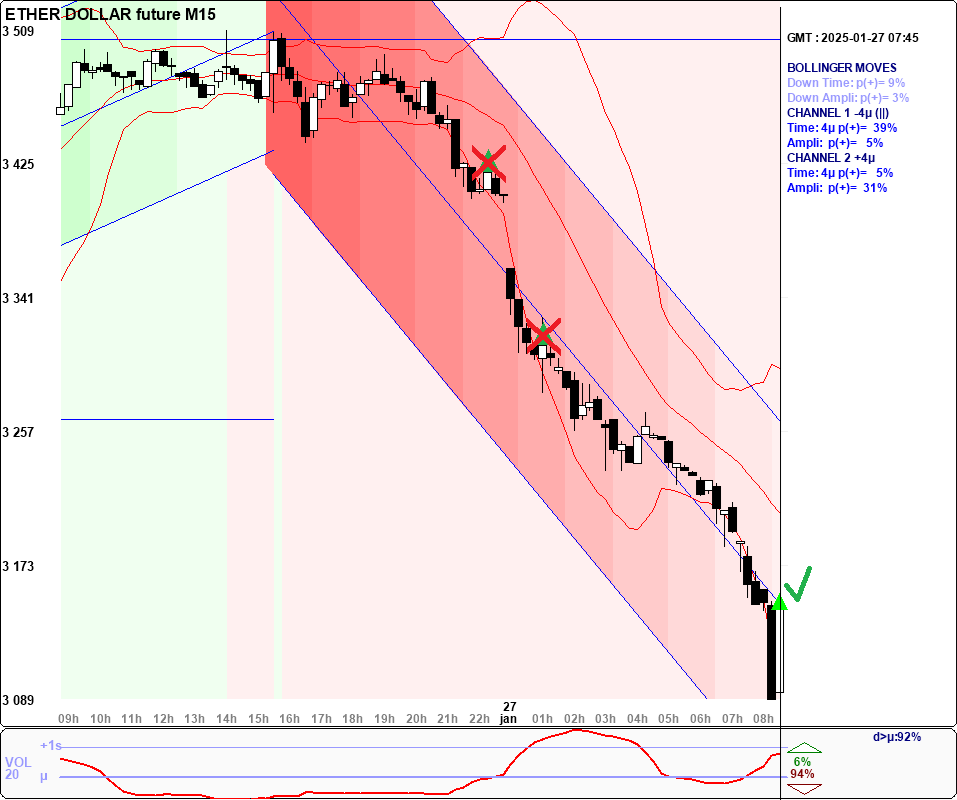
Example of invalidated signals:
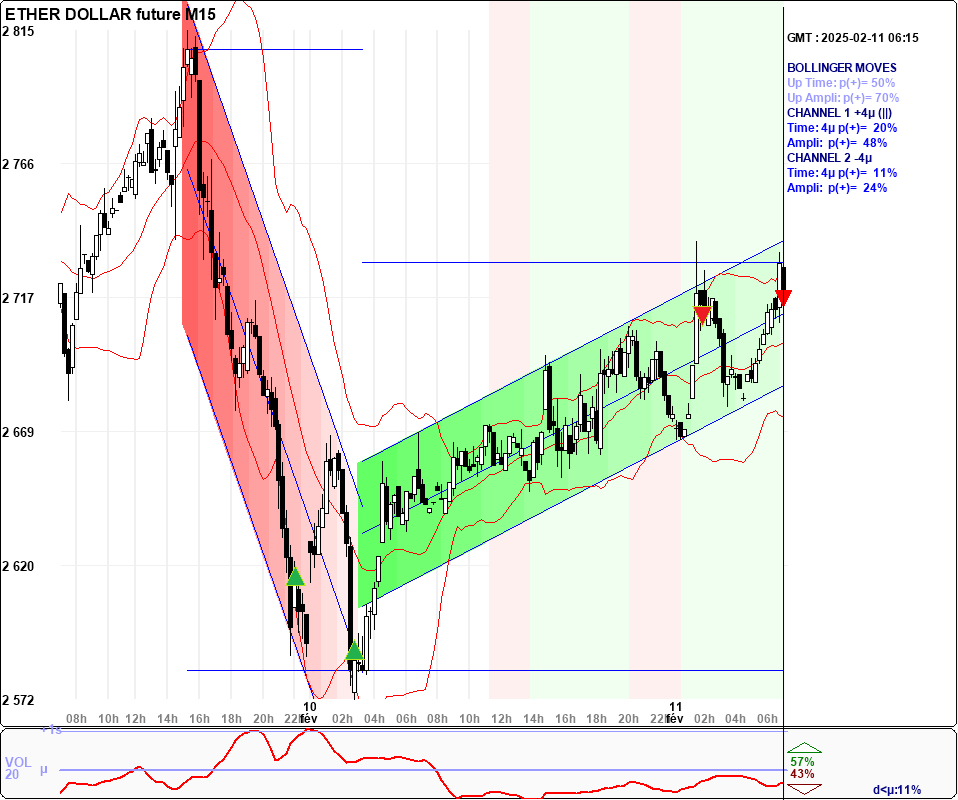
Example of statistical validation of a signal
- The AI has detected a possible reversal pattern (green arrow).
- The downward movement in the Bollinger bands has only an 8% chance of continuing.
- Bearish channel #1 has only a 20% chance of extending in amplitude.
- The chances of the bearish movement continuing are generally very low.
- The buy signal is therefore statistically validated.
- No traditional indicator allows such a decision.
What happened after:
THE STEPS TO FINANCIAL INDEPENDENCE
TO EACH HIS OWN STEP
We support you on the path to financial independence
EXCELLENCE STEP
- You want to compete with the markets of your choice
- You choose the market, from Scalping to Slow Swing.
- The charts move automatically with each candle, the analysis is updated.
- Depending on the analysis, place real orders with your broker, or in simulation here.
- Ideal for learning to master the laws of volatility.
ADVANTAGE STEP
- Monitoring one market is not enough for you, you want to monitor all of them.
- At a glance at the Radar, you identify markets close to decision points.
- You easily surf from one market to another, from Scalping to Slow Swing, always at the right time.
- More opportunities, more gains.
- Ideal for progress towards financial independence.
AMBITION STEP
- You don't want to miss anything, even without constantly monitoring the radar.
- Simply configure your alert conditions to enter the markets at the best timing.
- Receive notifications in real time, anticipate all statistically probable movements.
- Take the cruising speed of your financial independence.
YOUR EXCELLENCE STEP
SEE THE MARKET LIKE NEVER
Your AI-assisted trading
PERMANENT ANALYSIS OF MARKET DIRECTION
- Graphs and their analysis automatically refresh on the page.
- Statistics of extensions of price movements between Bollinger bands.
- Optimized plot and regression channel extension statistics.
- Analysis of internal availability of channels to authorize or not contrary signals.
- Graphical summary of the parabola of probable price development.
- From Scalping (M1/M15) to Slow Swing (H1/D), double analysis in two frequencies.
- Multi-frequency synthesis "What to do Now"
DIRECTIONAL GRAPHIC SUMMARY
- The summary of statistics makes it possible to trace the parabolas of probable price developments.
- Analysis of the development zones makes it possible to determine a preferred direction, expressed by an arrow.
- The statistical strength of this direction is expressed by a ratio rPL (Profit/Loss)
- A simple look at the graphical summary allows you to assess the market situation (The example above is neutral).
- Graphic synthesis allows you to validate or not an input signal.
DECRYPTED DATA
- All statistical data upstream of the synthesis are explained.
- Their graphic representation allows them to be quickly understood.
- From Scalping to Slow Swing, the representation is the same, you keep the same benchmarks.
- The AI recommends entry signals, but you can use your own in the same price zones.
YOUR ADVANTAGE STEP
YOUR RADAR IN ACTION
Scan all markets at a glance
A GLOBAL VIEW OF ALL MARKETS
- All probable directions and signals for all markets at a glance.
- All statistical summaries Scalping, Intraday, Fast Swing and Slow Swing.
- A simultaneous view on all asset classes (Stock Indices, Rates, Cryptos, Currencies, Commodities).
- Color coded in case of directional match and signals.
- Get into the right market, at the right time, in the right way, with all the features of EXCELLENCE.
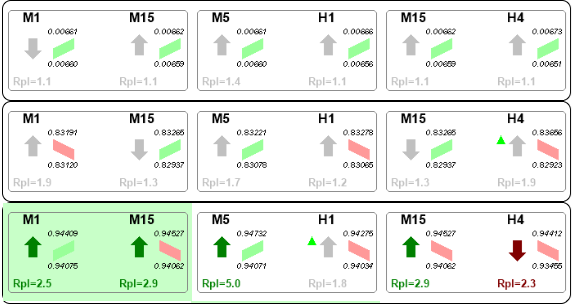
ALL DIRECTIONAL GRAPHICS
- All areas of likely price movement, with their direction.
- All the limits of the development zones (price objectives).
- All rPLs (Profit/Loss) ratios
- All signals detected by AI according to frequencies.
Radar example:
YOUR AMBITION STEP
ACCELERATE WITH RADAR NOTIFICATIONS
Don't miss any market opportunities
KEEP YOUR FREEDOM BUT ALWAYS BE PRESENT
- Let the site monitor all probable directions and signals for all markets.
- It will monitor all frequencies for you, Scalping, Intraday, Fast Swing and Slow Swing.
- Only focus your attention at appropriate times because you will have received a notification.
- You configure your preferences to only be notified about what interests you.
- Enter the right markets, always at the right time, without missing anything, with all the functions of ADVANTAGE.
INSTANT ALERTS
- You don't even need to constantly monitor screens anymore: AI does it for you.
- You receive an SMS notification which tells you which market and which frequency to join.
- Join the notified market with a single click, and manage your position.
- You can always intervene in the markets in an optimal way without necessarily being tied to your screen.
CUSTOMIZATION OF ALERTS
- The statistics used by AI to determine input signals have multiple dimensions.
- Select your notification rhythms from Scalping, Intraday, Fast Swing and Slow Swing.
- Easily set your personal conditions, for notifications with more restricted or broader conditions according to your own style.
- Test the effectiveness of your trading notifications based on your personal criteria using the simulation functions.
- Full control of the power of AI.
|